
[The aims of this project]
We are living in a super-ageing society. Population is estimated to decline further over the next 25 years. In order to achieve the sustainability of society, it is necessary to sustain Capital Stocks (Human Stocks, Material Stocks, Natural Stocks, Social Stocks) which underpin societies and to ensure hand-over from one generation to another.
These social circumstances require the comprehensive community planning, based on the outcomes of predicting how local capital stocks will change in each locale and of considering on how local capital stocks can be managed.
As local capital stocks are different from each other, it should be managed by each local authority. However, there is not enough accumulated experiences.
In this project, with a view of assisting city officials, we develop a data-base which can compare the local capital stocks between those of each local authority, and will develop a software which can predict the possible changes of local capital stocks in the future. →”Future Chart (MIRAI Karte)”
Also, this project will establish methodologies of stock management which include producing a scenario based on prediction on future changes, and a method of consensus building through promoting participation of multi-generation. The goal of this project is to ensure the sustainability at local levels through familiarizing such methodologies.
~~~~~~~~~~~~~~~~~~~~~~~~~~~~~~~~~~~~~~~~~~~~~~~~~~~~~~~~~~~~
The project obtained funding from the Japan Science and Technology Agency (JST) and the Research Institute of Science and Technology for Society (RISTEX) in 2014 under the ‘designing sustainable multi-generational, co-creational society’ research and development area.
The particip
ants of the project are: Chiba University, Shibaura Institute of Technology, National Institute for Environmental Studies, Ichihara City, Yachiyo City, Tateyama City, and Chiba Prefecture. Principal Investigator:
Professor Hidefumi Kurasaka, Chiba University.
*brochure(pdf): opossum-english
*IAIA2016(13 MAY)http://conferences.iaia.org/2016/index.php
“Social sustainability assessment in societies with decreasing populations”
Presentation-slides are here.
“Future Mayor Workshop“
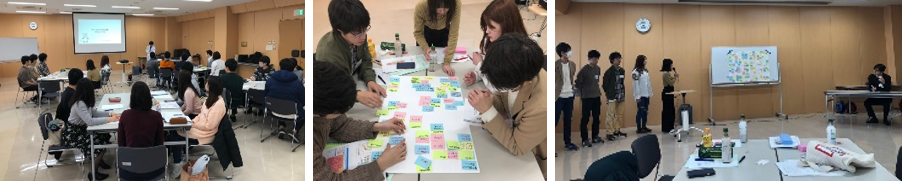
“Future Mayor Workshop” is a workshop that makes students at junior high school and high school role-play becoming the future mayor, think about the issues and policies in the future society, and propose to the present mayor the policy that they want the mayor to implement from now.
The workshop is divided into input and output parts. First, in the input part, a professor explains the “Future Chart” and makes the participants time slip. They write down what they were interested in the future society. In the output part, they think about future issues and policies through individual and group works. Finally, each group presents the policies it has considered to the current mayor.
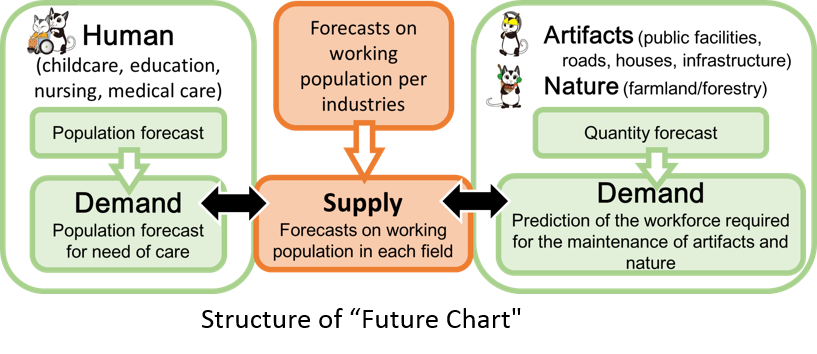
“Future Chart”
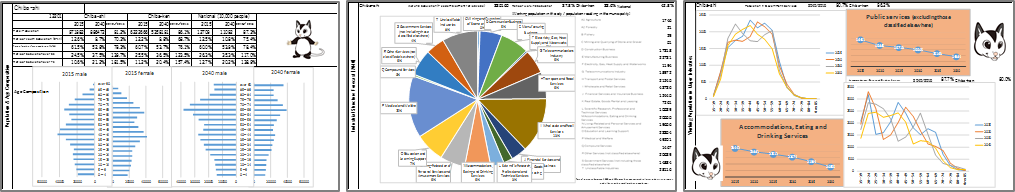
“Future Chart” is a simulation program that shows how the future will be if the current situation does not change. Population decline and aging are major issues in Japan. This chart predicts changes in the working population and labor shortages if this trend continues. This is not a “prediction to predict”, but a “prediction to notice”. The “Future Chart” visualizes future social issues by comparing the supply and demand of the present and future population and labor. If the current trends can be changed by the current policies, the future shown in the chart can be changed.
There are 1741 municipalities in Japan. Future Charts are created for each municipality. Anyone can see the chart of any municipality by entering its code. We made it available for free download so that it can be widely used, such as being used for policy making by local governments. The file uses EXCEL so that anyone can use it easily.
How to Download “Future Chart 2050”
“Future Chart” was released in 2017, and has exceeded 10,000 downloads in the two weeks since its release. In July 2020, it was released version 2 that predicts society in 2050.
If you would like to download “Future Chart 2050”, please fill out the necessary items below and send. We will tell you the password required for downloading by automatic reply. The information you provide will be strictly managed by the Kurasaka Laboratory, Graduate School of Humanities and Social Sciences, Chiba University, and will not be used for any purpose other than providing information (update information, etc.) regarding this “Future Chart 2050”.
For the user name and password required to be entered, enter the password described in the automatic reply email. (Because the size is about 150MB, it may take some time to download).
This program can be downloaded for free, but we would be very grateful if you could donate to the NPO Regional Sustainability Research Institute, which is the developer and operator of this program. If you would like to make a donation, please select the purchase amount using the amount selection buttons below and then click the “Buy Now” button. In this case also, it is necessary to fill in and send the above required items.
How to Use “Future Chart 2050“
1.Select a municipality
Enter the municipal code in the yellow cell on the top right of the first page. The code can be confirmed on the “Municipality Code” tab.
(You can refer to the nationwide aggregate value as 50, the aggregate value for municipalities where the population is concentrated as 51, and the depopulated area as 52. However, these cannot select policy cases.)
- Select a policy case
You can choose from three types of policy cases: extending retirement age, returning young people to the local community, and increasing fertility.
Policy cases can be selected by entering a number from 2 to 4 in the “Case selection” field. After selecting, please clear the input numbers. If “1” is entered in the “Case selection” field somewhere, it becomes a normal case. If the numbers “2”, “3” and “4” are entered at the same time, the order of “2”> “3”> “4” will be given priority. If nothing is entered, this is the normal case.
[1]Normal Case
[2]Case of extension of retirement age: When the proportion of workers aged 60-64 is the same as that of those aged 55-59, and the proportion of workers for subsequent generations is gradually increased.
[3] Case of where young people return to their hometowns: When the recovery rate of “20-24 years old 5 years ago and 25-29 years 5 years later” is improved by 10% compared to the normal case (Companies Research Institute Population Prediction case) is.
[4] Case of increasing fertility: 5% of women aged 15-39 will have one more child than usual in the next five years.
- Other
・You can easily see it by placing the cursor on the leftmost cell and scrolling.
・The horizontal axis of the graphs of “Age composition” and “Industrial structure by age” are automatically adjusted.
・The blowout of the “Industrial structure” graph is automatically adjusted, so adjust it to a position that is easy to see.
・The pie charts balloons are automatically adjusted. First, right-click on the pie chart and select “Select Data”, and for the item that is “0” in the table on the next page, uncheck “Horizontal (item) axis label”. After that, adjust it to a position that is easy to see if necessary.